Live Demo – Power BI Ultimate Charts Waterfall & Variance IBCS (R)
Video 2: Start Value
Let me introduce the Ultimate Waterfall Chart, a custom visual that will soon be available in the gallery. Let’s take a more detailed look at the first example I prepared. It is not a final dashboard; it only contains the charts or features I want to explain. The charts broadly follow the IBCS(R) standard.
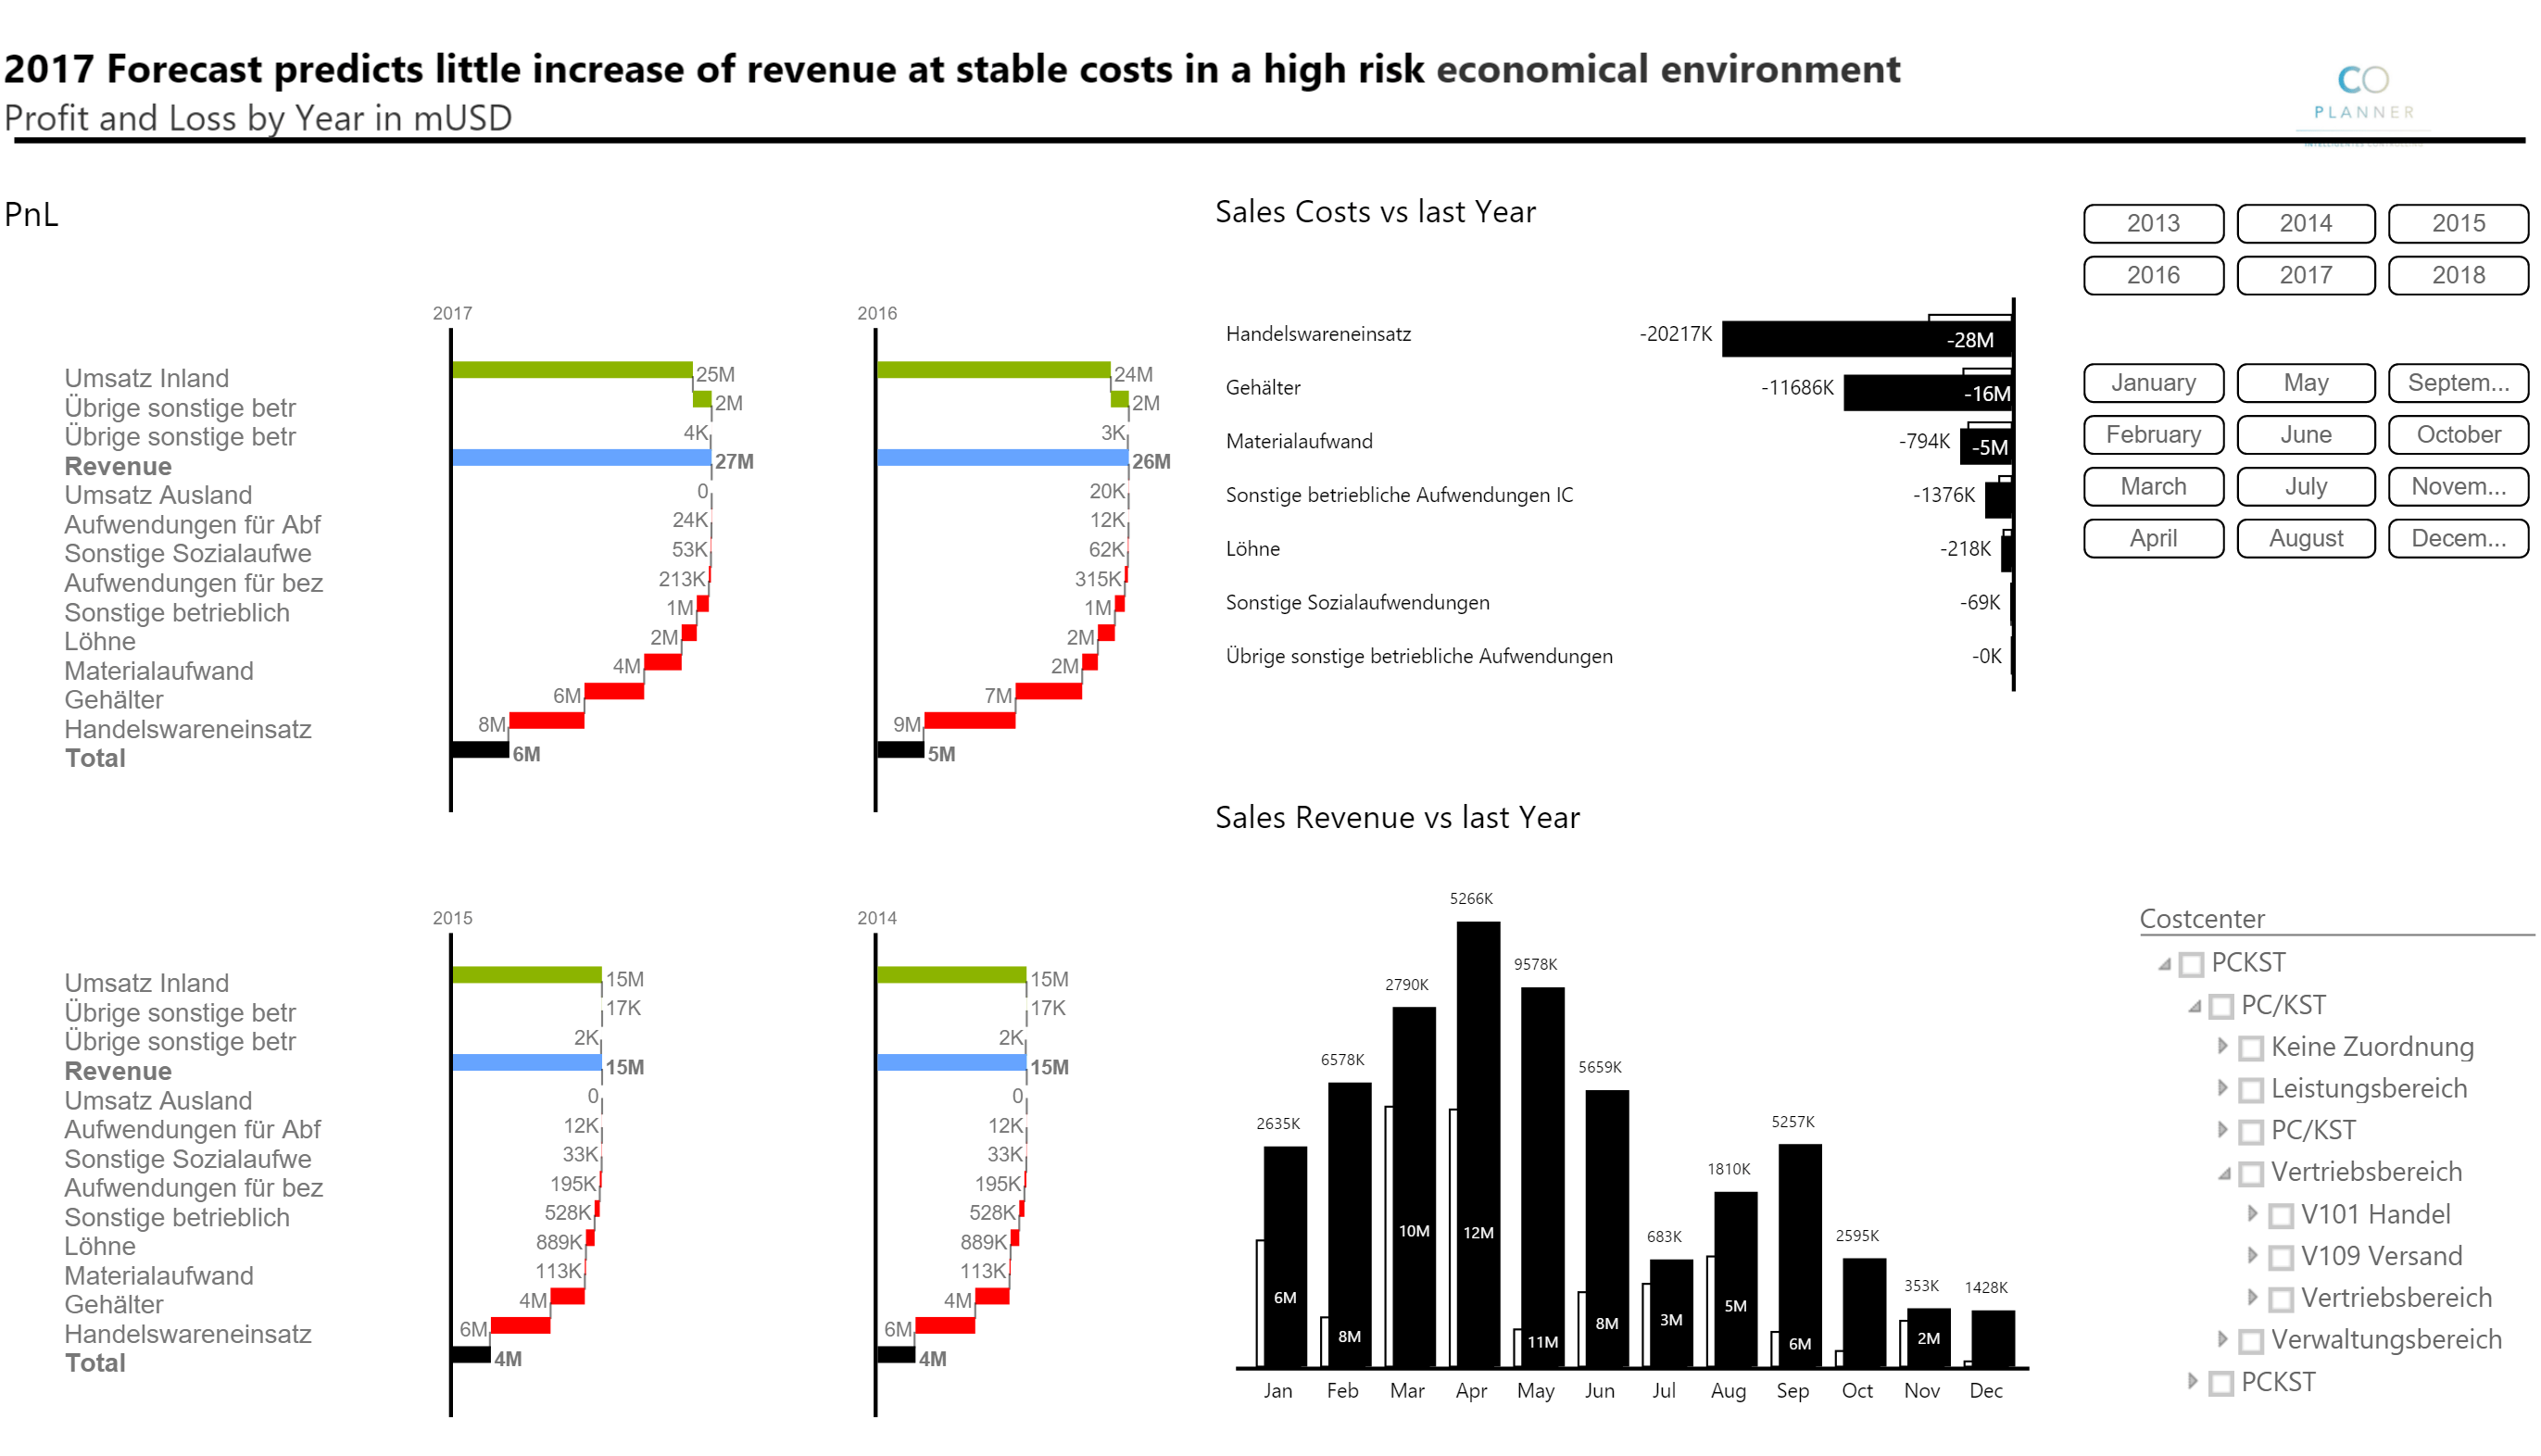
Here we are looking at a vertical, or so-called calculation, waterfall chart. The status bars represent base and result measures (for example, sales and EBIT), while the contribution bars in between represent the increase or decrease of the measures. It is used for every category except time series, which I explain later in the second part of this post. This vertical waterfall is also grouped by years, so it is a so-called small multiple chart. One single chart is essentially multiplied by another dimension/column. Because, for example, 1,000 USD has the same bar size/length in all charts, a visual comparison of the small multiple charts is possible. We call this same scaling.
The blue bar is a manually added subtotal sum. You can also change the color of these types of bars for special highlighting if needed. You can basically change the colors of all bars in these visuals. The default colors also follow the IBCS colors. Last but not least, it is also possible to sort the charts inside the small multiples by the multiplied category.
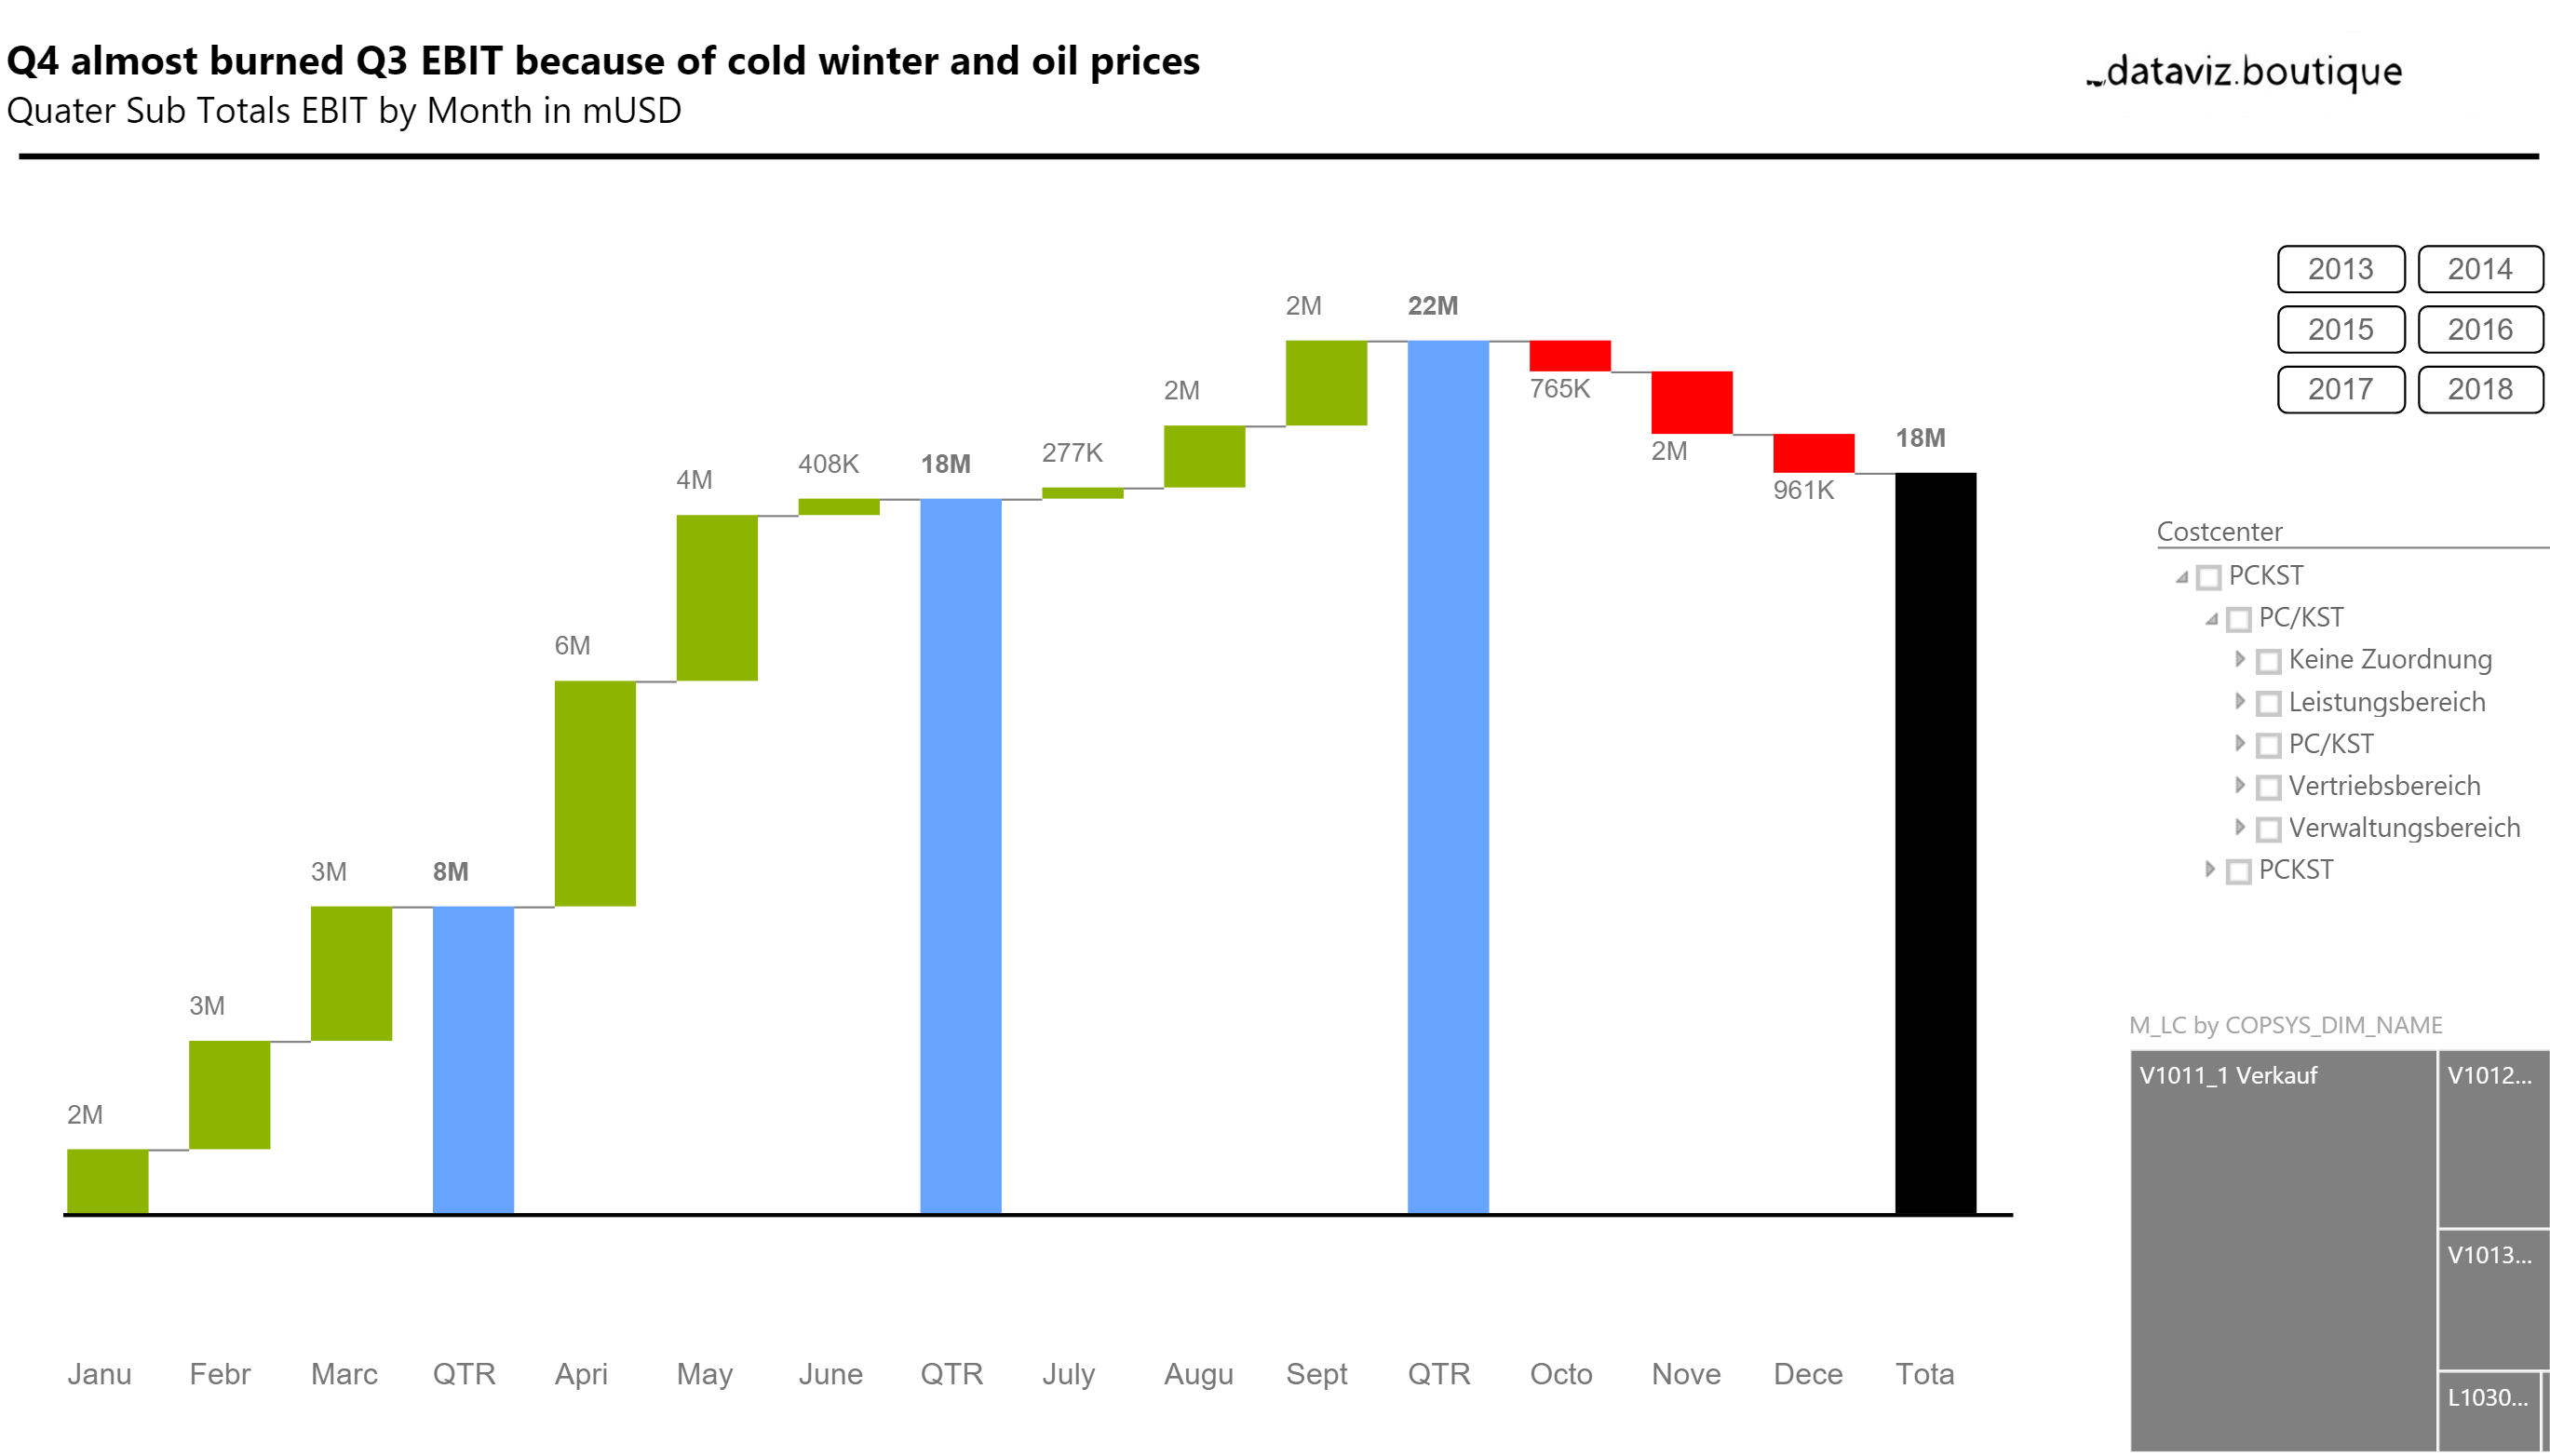
Below you see an example of a horizontal waterfall chart, which is used for time series only. Here we have a single chart (of course, small multiples are also possible) with three subtotals and the total value, each of which represents the year-to-date (YTD) value. This is the sum of three months for Quarter 1 and the sum of the first nine months for Q3 YTD.
We are happy to receive your feedback, suggestions for enhancements, and criticism as well. These charts broadly follow the rules of the International Business Communication Standards (IBCS ®) http://www.ibcs-a.org/.
Please do not hesitate to contact us using the form or read the FAQ:
Related: Ultimate Charts product families and license options.