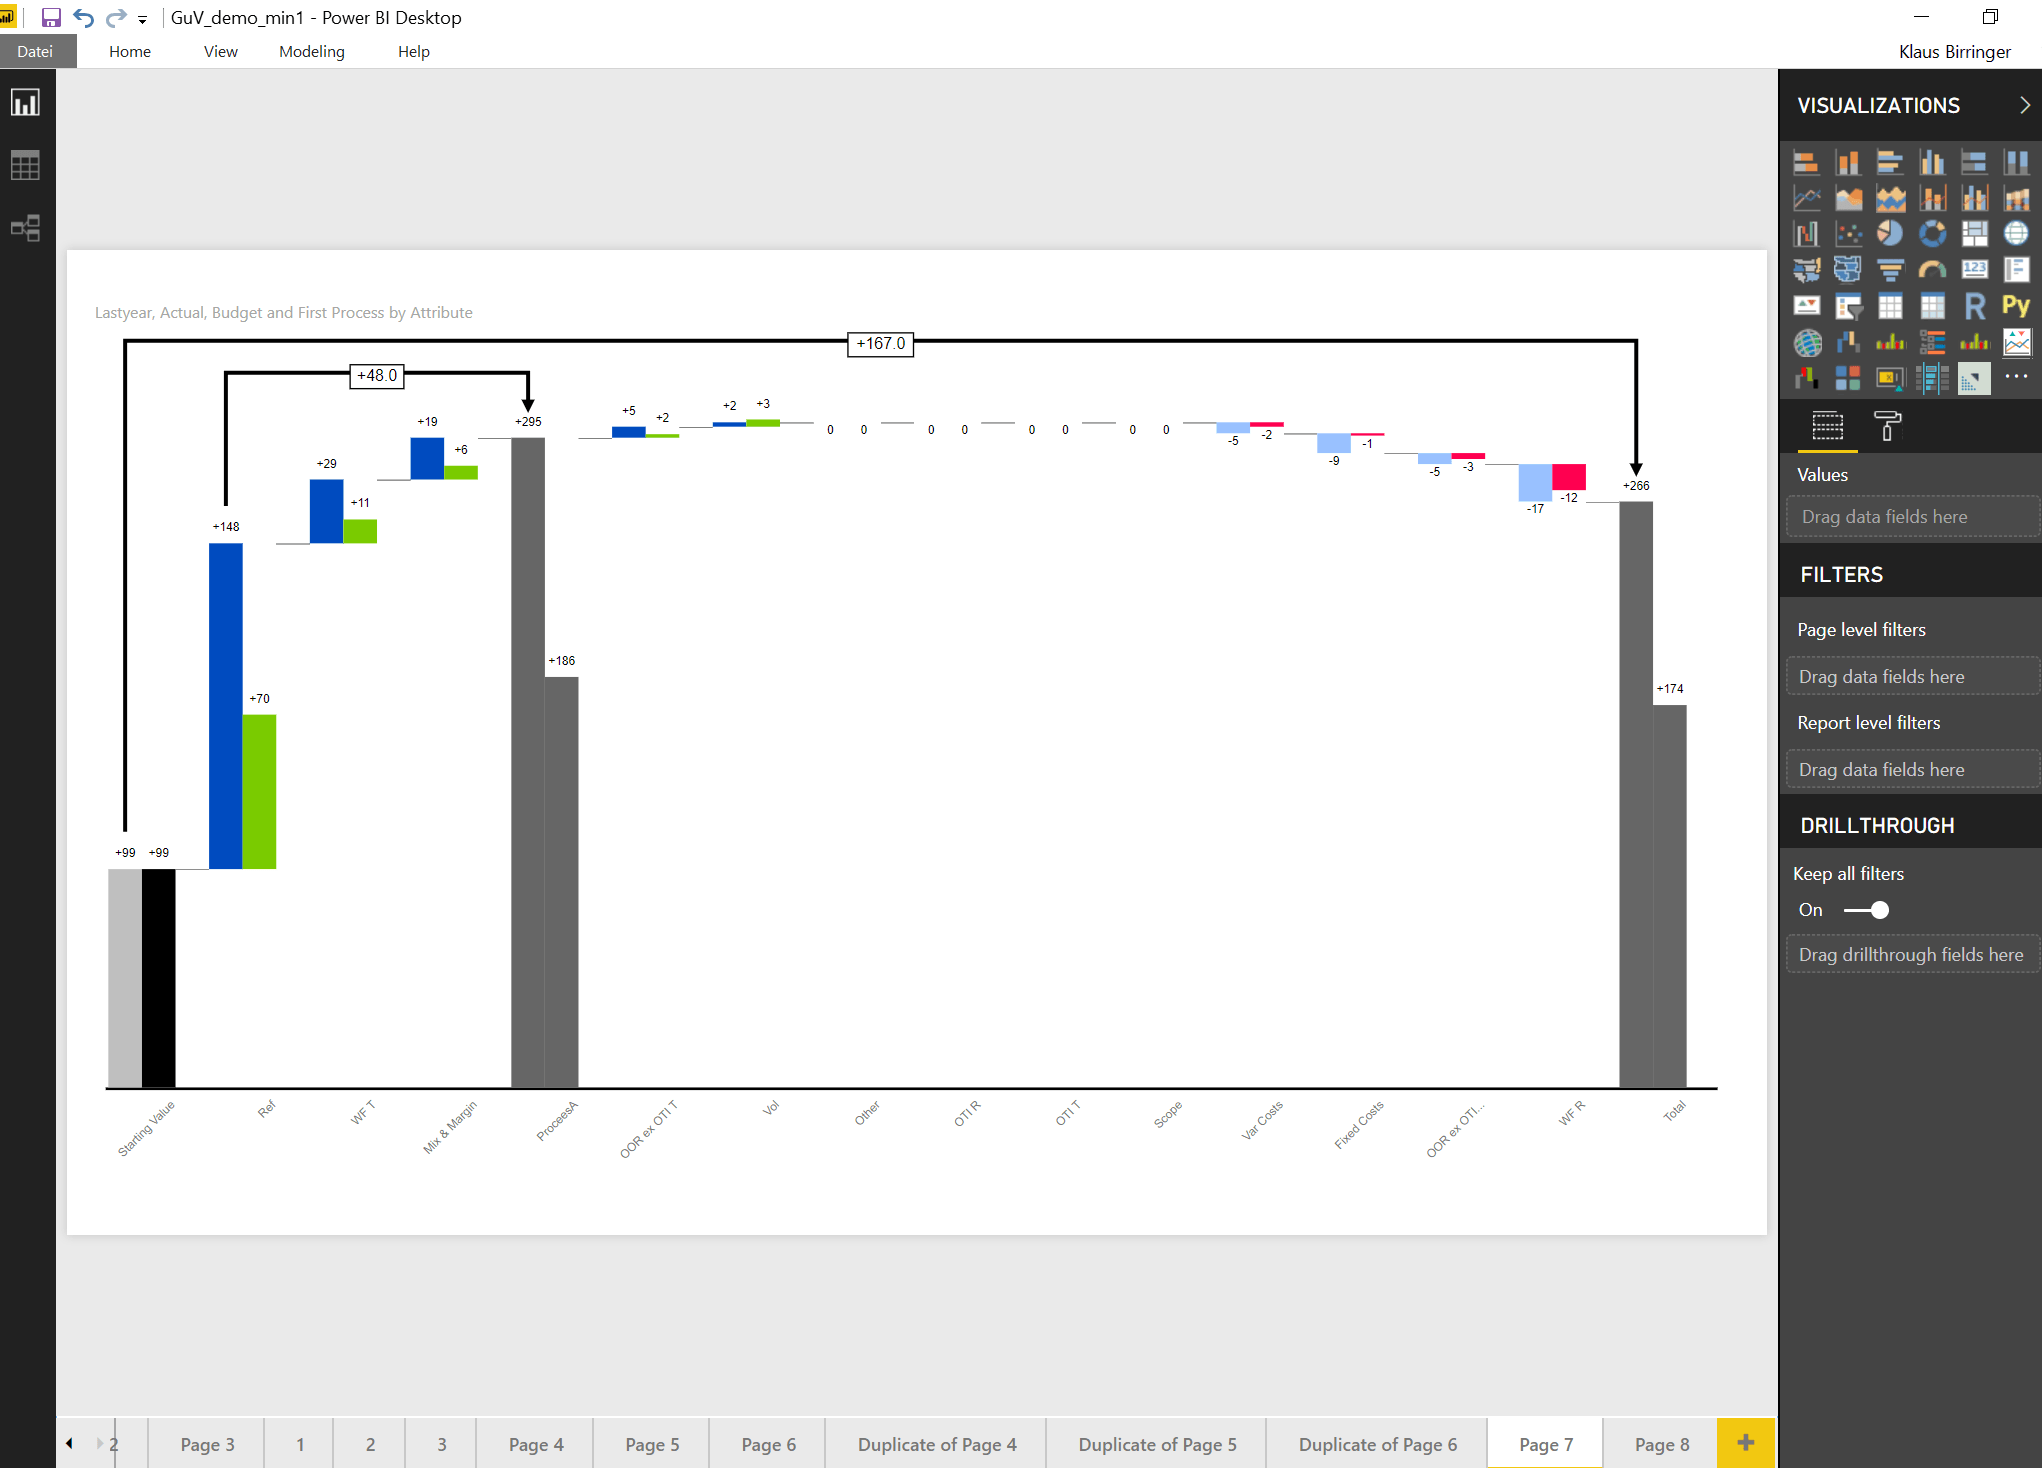
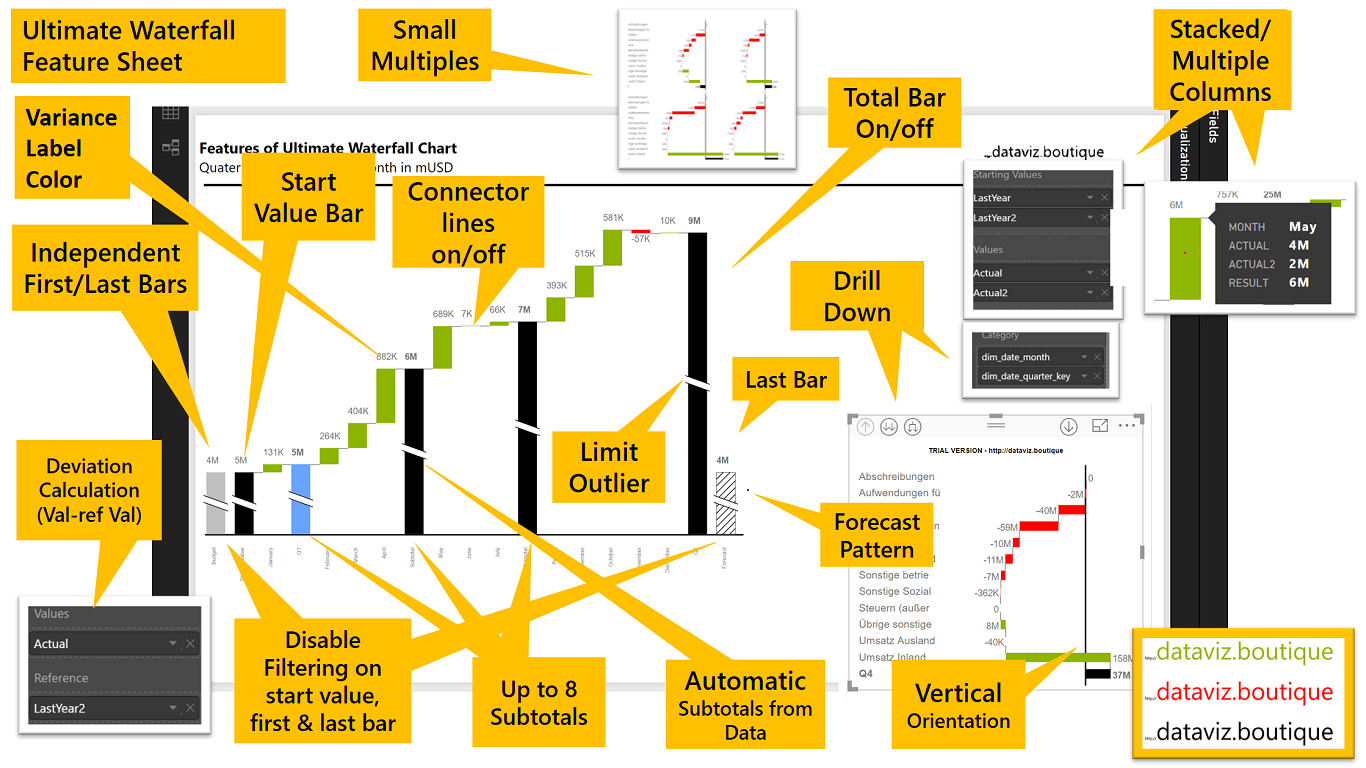
Waterfall charts also have other names, such as walk charts, bridge charts, flying brick charts, and Mario charts (as in Nintendo). We can display highlights, subtotals, and a second reference bar.
Download the full documentation and trial version by providing your details:
[email-download download_id=”12976” contact_form_id=”14252”]
Ask me a question.
Frequently asked questions
1) What is the Trial Version?
2) What is the Commercial Version?
3) How do subtotals work?
4) How should I use the Value, Reference Value and Starting Value fields?
5) Why should I download the visuals from here instead of the Office Store?
6) How do I import or update custom visuals correctly?
9) What is First Bar and Last Bar?
10) What is Disable Filtering?
11) What is an automatic subtotal?
1) What is the Trial Version?
This version has the full functionality but is marked with a watermark inside the visual. It also has a time limit. Currently, the most recent trial versions are only available in the Live Demo here. Join the private preview program to get the most recent, up-to-date versions as .pbiviz files on request.
2) What is the Commercial Version?
This version has the full functionality, the latest features, and no watermark. Contact us for detailed pricing or reseller information. Or order now here.
3) How do subtotals work?
You can define the position by entering the index values separated by commas. For example, use 4, 7, 10 to create three subtotals.
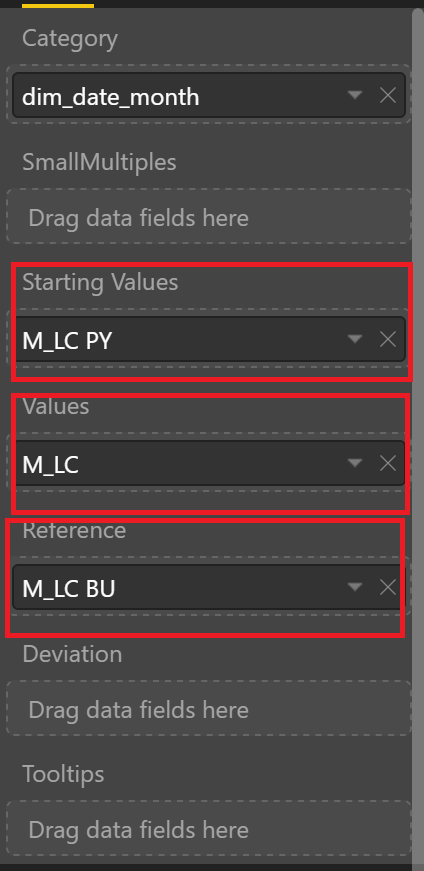
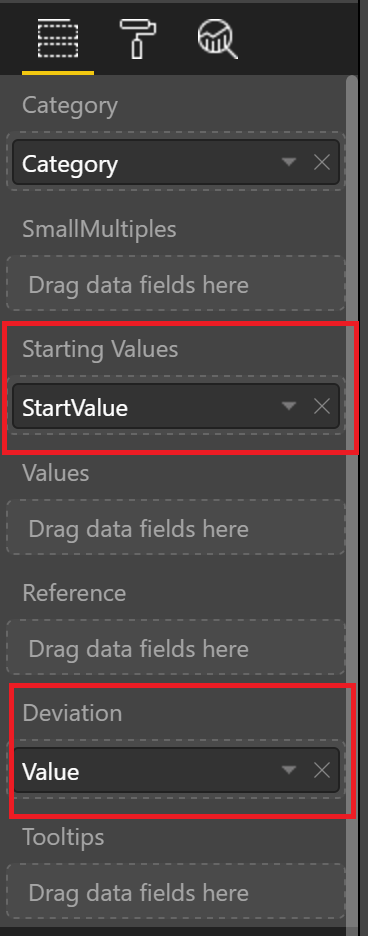
4) How should I use the Value, Reference Value, and Starting Value fields?
You can use either 1) Value & Reference Value fields OR 2) only the Value field.
In Case 1, the deviation between reference and value will be calculated and displayed.
Total Value = Start Value +/- Movement (increase/decrease)
If you use the “Starting Value” field, you have to use the “Value” field as well.
Case 1:
|
5) Why should I download the visuals from here instead of the Office Store?
We have the same issue as others: approved versions take about three weeks to be released because the Power BI team reviews every submitted version. That is why you will always find here the latest version with the newest features and functions.
6) How do I import or update custom visuals correctly?
Import the custom visual. Save the Power BI Desktop file. Close Power BI Desktop and reopen it. In case of persistent problems: Please clear the browser cache. To remove the Power BI Desktop cache, remove everything in “C:Users%username%AppDataLocalMicrosoftPower BI Desktop” except user.zip, and then try to use the visual again. For the Power BI Desktop version from the Windows Store, delete the cache here: C:\Users\xxxxxxxxx\Microsoft\Power BI Desktop Store App.
9) What is First Bar and Last Bar?
We now support columns/value fields placed at the beginning and at the end of the waterfall chart. However, these values do NOT count in the waterfall calculation. They are only rendered as normal bars.
10) What is Disable Filtering?
This disables report-level filters for the First Bar, Last Bar, and Start Bar. Once you filter the report, the bars do not respond when this setting is turned on. The setting can be turned on or off.
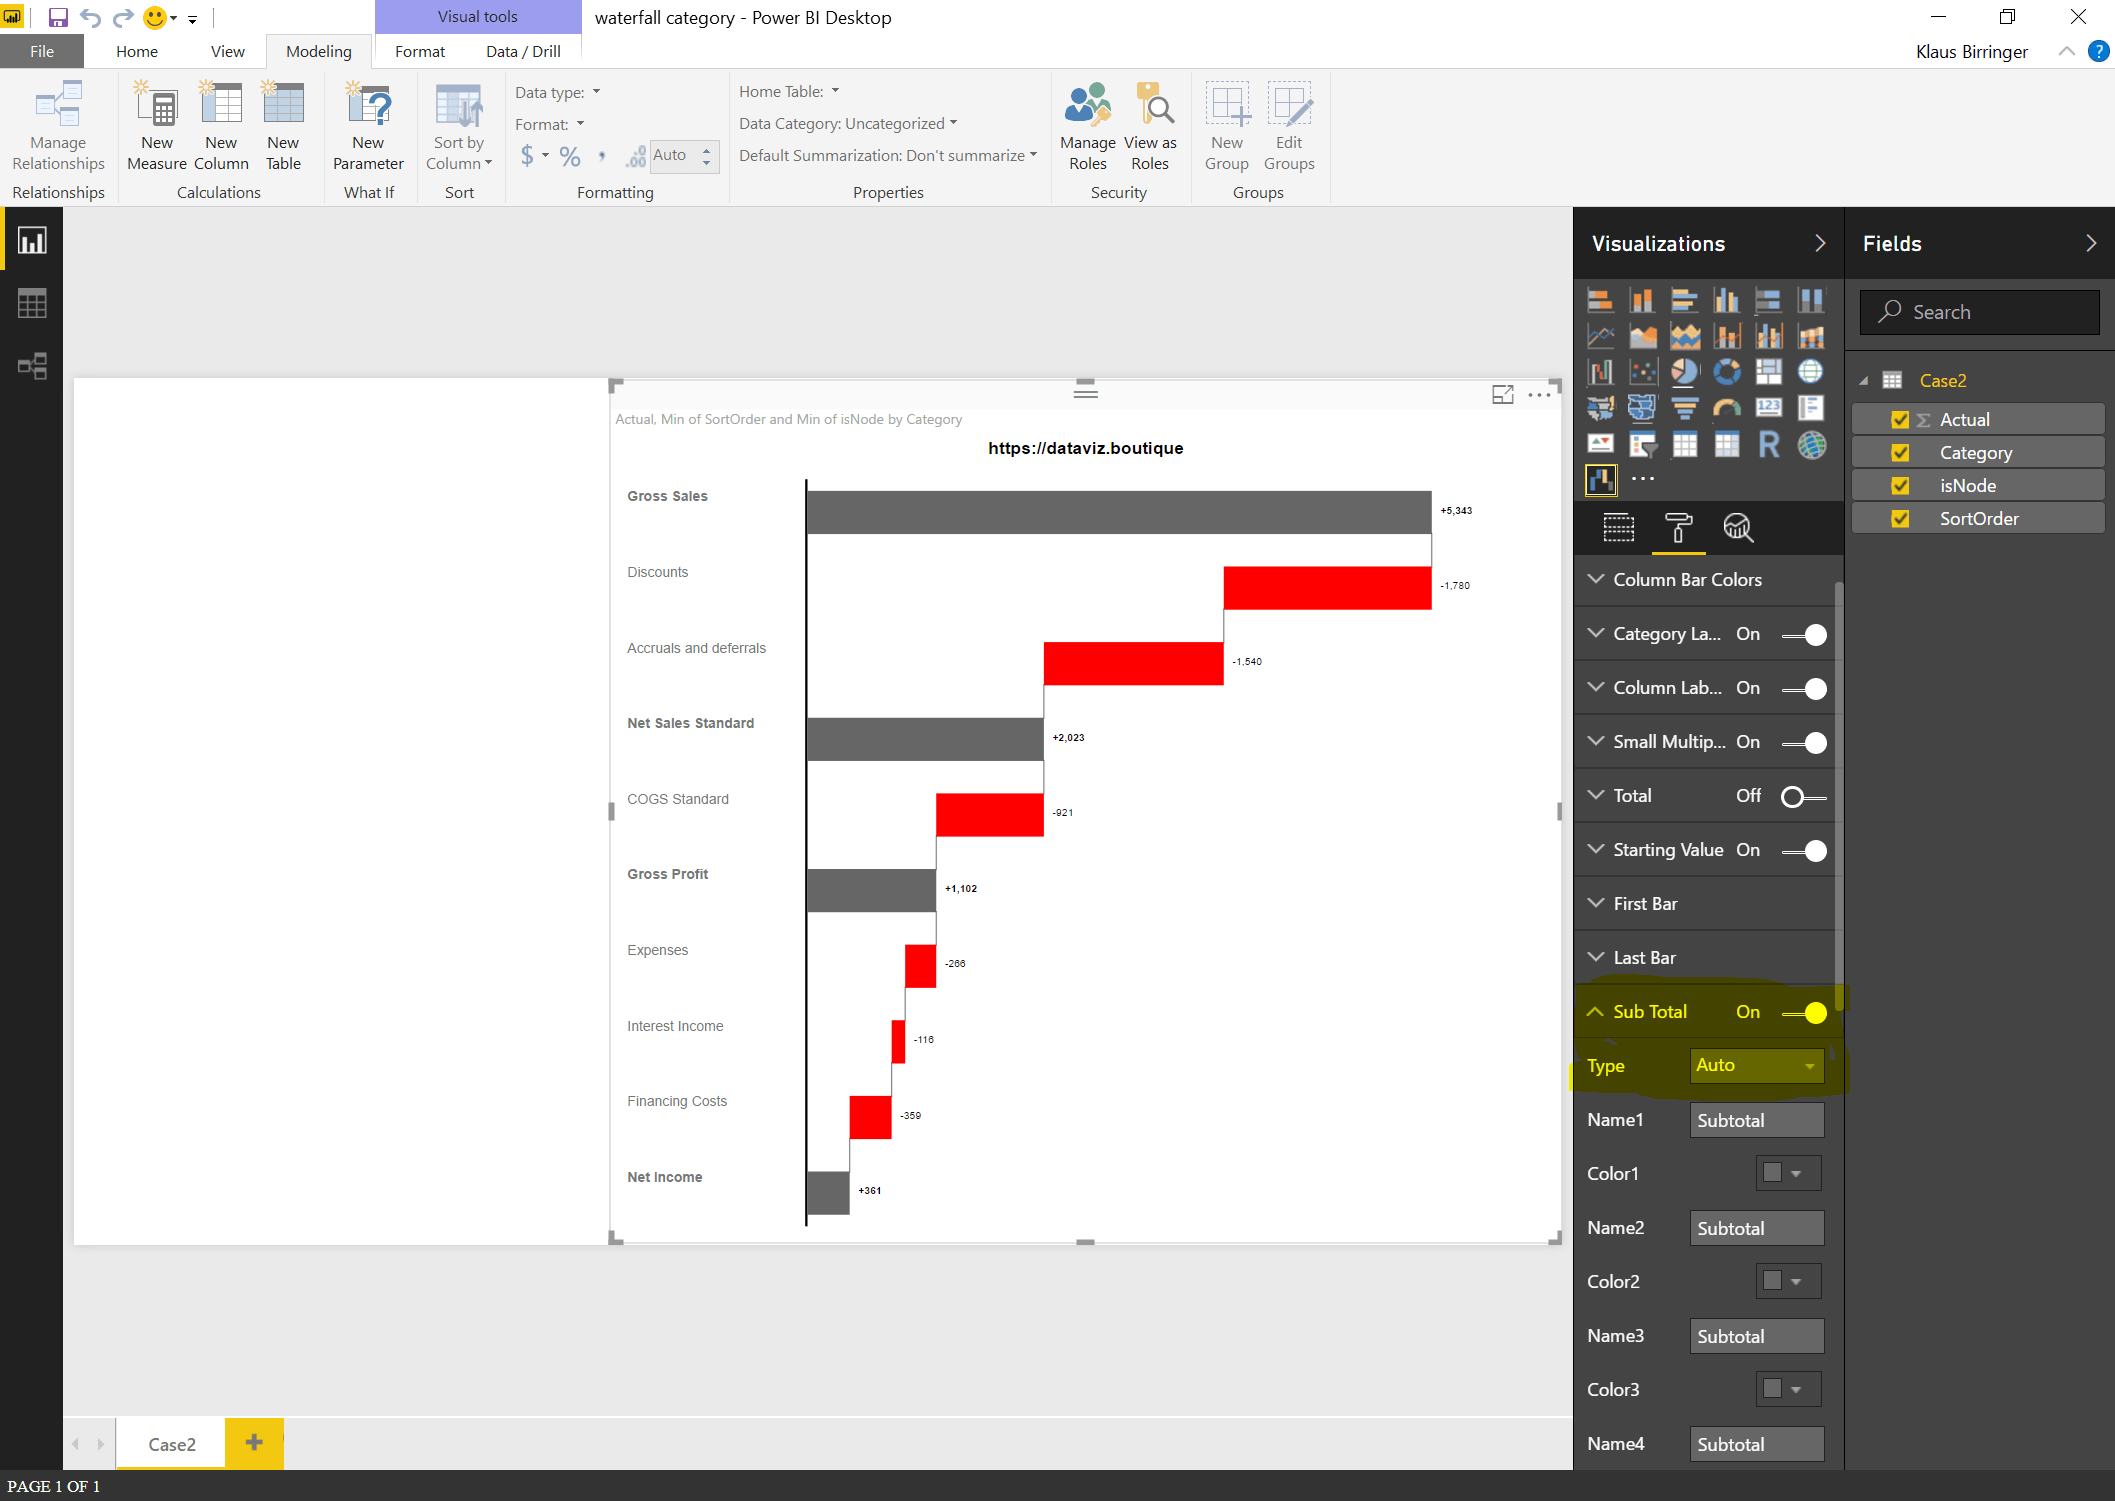
11) What is an automatic subtotal?
If isNode equals 1, we display a subtotal in the category waterfall. The subtotal value will be taken from the data and will not be calculated.

Please do not hesitate to contact us using the form: