Ultimate Stacked
Power BI stacked chart reporting use cases Ultimate Stacked is useful when a Power BI report has to show both the total value and the mix behind that total. Typical examples include revenue by product…
Documentation
Power BI stacked chart reporting use cases Ultimate Stacked is useful when a Power BI report has to show both the total value and the mix behind that total. Typical examples include revenue by product…
This guide explains how report consumers and report authors can use and configure the Ultimate KPI Card 5.1.2.3 API License Power BI custom visual. It is written from an end-user/report-author perspective and focuses on the…
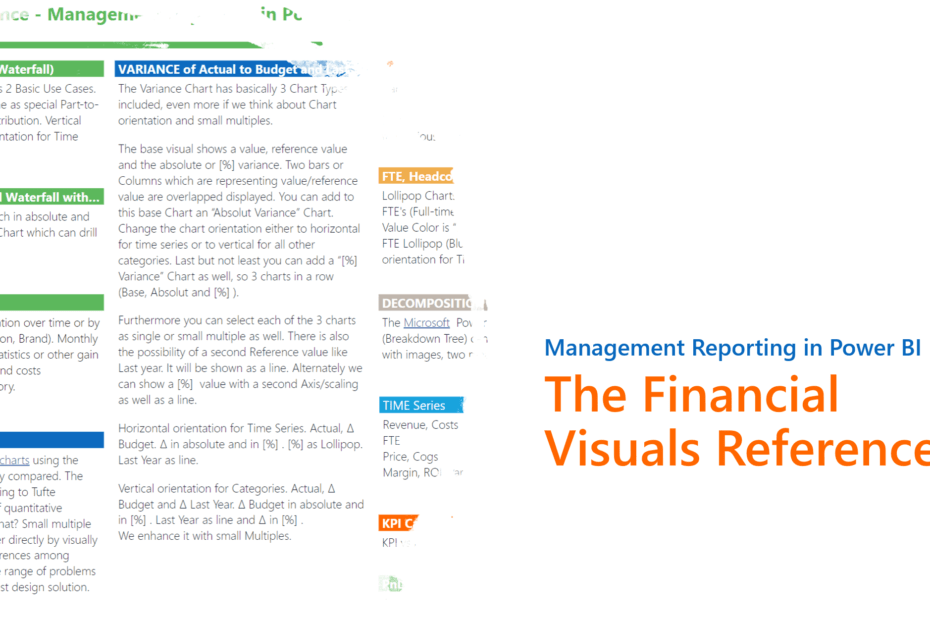
The Financial Visuals Reference: Management Reporting in Power BI The Waterfall Contributions Analysis charts have two basic use cases: showing the contribution of a category or time period as a special part-to-whole chart, and showing…

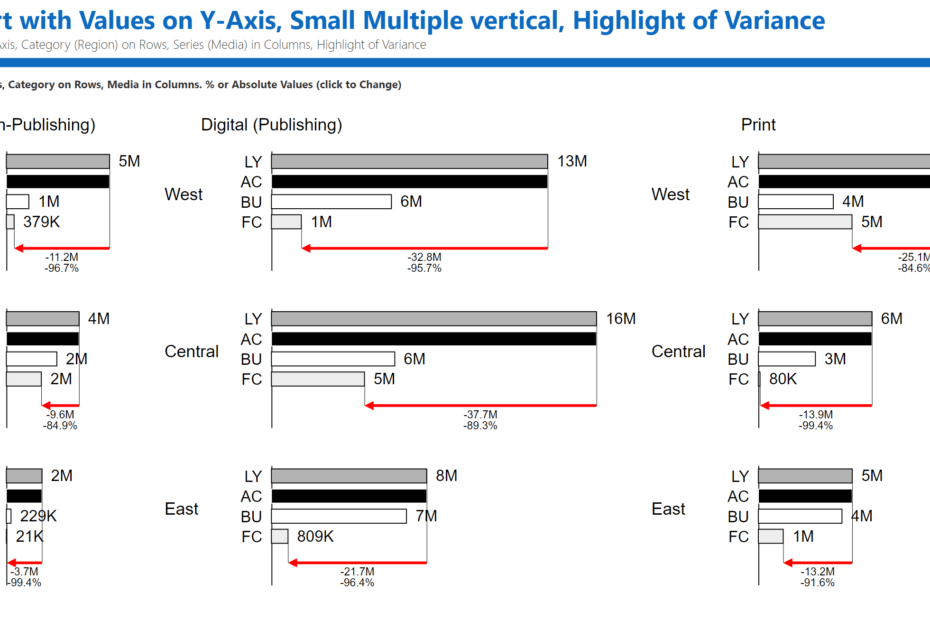
Power BI Ultimate Variance Chart This chart is designed to compare and visualize variances in finance, such as actuals vs. budget or forecast. The Power BI Ultimate Variance Chart custom visual includes three basic chart…
Waterfall charts also have other names, such as walk charts, bridge charts, flying brick charts, and Mario charts (as in Nintendo). We can display highlights, subtotals, and a second reference bar. Download the full documentation…

Why should I download the visuals here instead of from the Office Store? You will always find the latest version here, with the newest features and functions. Currently, the most recent versions are available in…