Valid for
3 Report Authors and 120 Report Reader
or
4 Report Authors and 110 Report Reader
…
Microsoft Power BI Ultimate Decomposition Tree Visualization (Breakdown Tree)
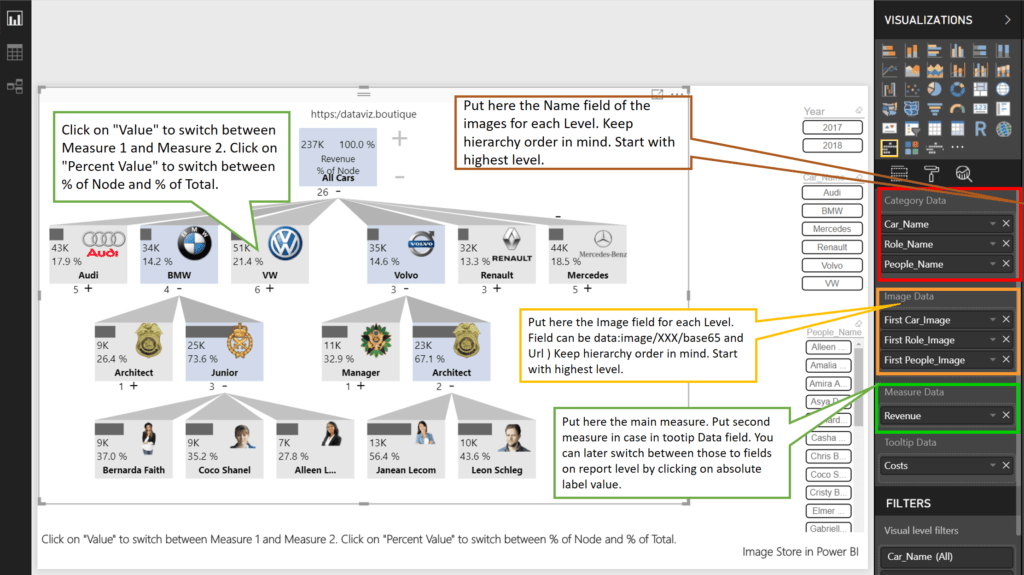
The Microsoft Power BI Ultimate Decomposition Tree (Breakdown Tree) can display hierarchical Information with images, two measures and % calculation as well. This kind of visualization is well know from the great ProClarity Software which existed years ago.
Features:
-
- Breakdown of Values and “% of” Calculations
- Image Support (Web Url or stored in PowerBI)
- Vertical and horizontal orientation
- Support of 2 Measures
- Bar as absolute Value indicator
- “% of Node” and “% of Total” Calculation
- Many customization settings
Views: 201


