Showing all 9 resultsSorted by price: low to high
Power BI Ultimate Variance Custom Visual
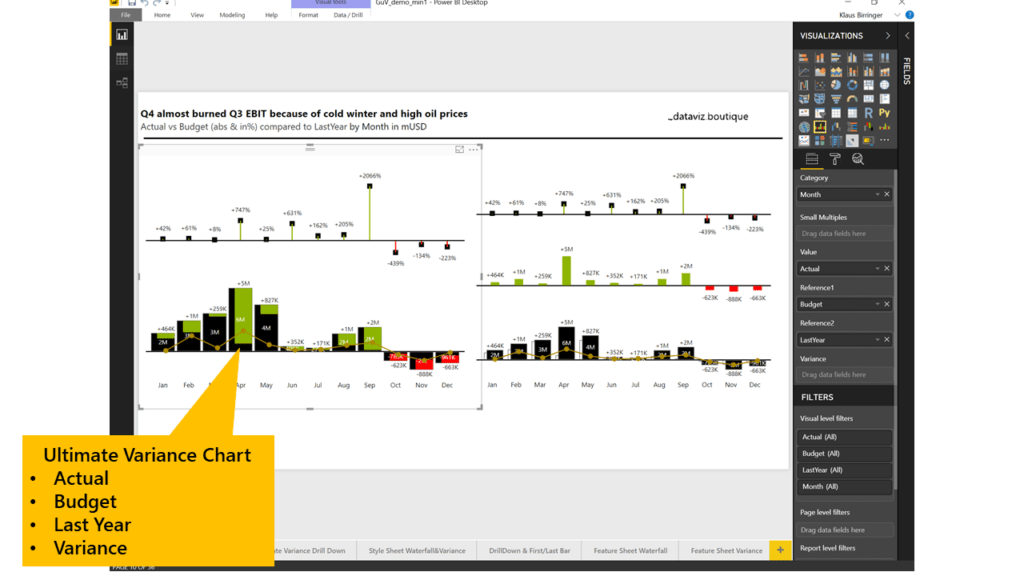
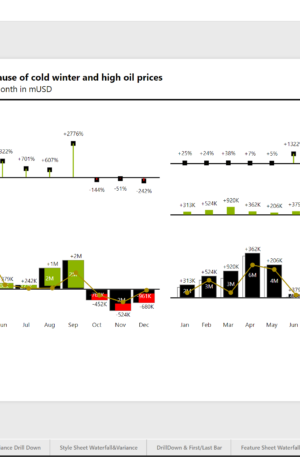
Ultimate Variance is a Power BI custom visual for showing values, reference values, and deviations in a clear reporting format. The product information describes three chart types: a base variance visual that shows a value, a reference value, and the deviation, plus bar or column views that make positive and negative differences easier to compare.
This category is aimed at finance, controlling, sales operations, and management reporting teams that need quick comparison between actuals and another reference point. Typical references are budget, plan, forecast, previous year, target, benchmark, or another scenario. Instead of forcing report users to calculate the difference mentally, Ultimate Variance presents absolute and percentage variance directly in the visual.
Best-fit reporting scenarios
- Actual versus budget, forecast, target, or previous-year reporting.
- Financial dashboards where deviations need to be visible immediately.
- Sales, margin, cost, headcount, and KPI reports that need both value and variance.
- Management reports that must explain where performance is above or below expectation.
Key features
The visual is useful when a normal bar chart is too limited and a full waterfall is more than the report needs. It keeps the focus on comparison: value, reference value, absolute deviation, and percentage deviation. The result is a compact Power BI visual that works well in dashboard grids, report pages, and executive summaries.
Licensing and product options
The product options below provide different Ultimate Variance license levels. Use the smaller credit options for narrow deployments and the larger options for wider teams or recurring client reporting.
Available product options
- 10 Credits Ultimate Variance
- 15 Credits Ultimate Variance
- 2 Credits Ultimate Variance
- 20 Credits Ultimate Variance
- 30 Credits Ultimate Variance
- 5 Credits Ultimate Variance
- 50 Credits Ultimate Variance
- Sales Offer Unlimited Credits Ultimate Variance
- Unlimited Credits Ultimate Variance