Showing all 9 resultsSorted by price: low to high
Power BI Ultimate KPI Custom Visual
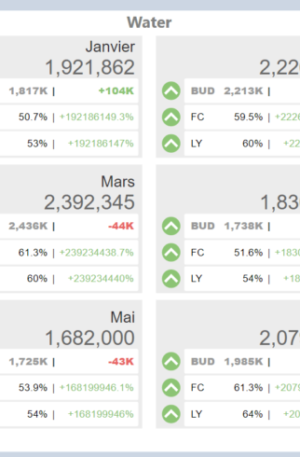
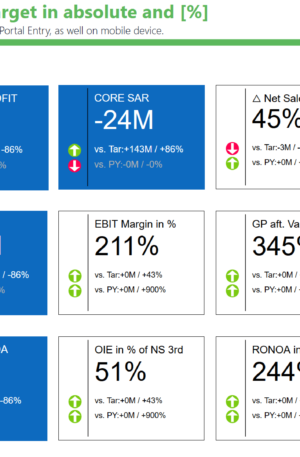
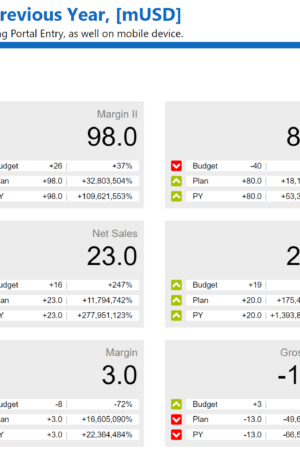
Ultimate KPI is a Power BI custom visual for KPI cards that need more context than a single number. The product pages describe a visual that shows a value, its variance to a reference value, and its variance to a second reference value in absolute and percentage terms, including arrows for quick interpretation.
This makes the category especially relevant for management dashboards, financial reporting packs, sales reports, operations reports, and executive summaries where users need to understand performance at a glance. A KPI card should not only show the current value; it should explain whether the value is good, bad, above plan, below forecast, or moving in the right direction.
What Ultimate KPI is useful for
- Actual, budget, forecast, target, and previous-year comparisons.
- KPI tiles for revenue, margin, EBIT, EBITDA, cost, volume, conversion, productivity, or service levels.
- Dashboards where absolute and percentage variance need to be visible together.
- Reports that require clear visual indicators such as arrows and conditional formatting.
Key features
Ultimate KPI is designed for dense Power BI report pages where many indicators compete for attention. It combines value, references, variance, and visual status cues in one compact component. This helps report readers understand the story without opening a detail page for every measure.
Licensing and product options
The products below cover different Ultimate KPI license or credit levels. Pick the option that matches the number of report authors, readers, or deployment scope required by your Power BI environment.
Available product options
- 10 Credits Ultimate KPI
- 15 Credits Ultimate KPI
- 2 Credits Ultimate KPI
- 20 Credits Ultimate KPI
- 30 Credits Ultimate KPI
- 5 Credits Ultimate KPI
- 50 Credits Ultimate KPI
- Sales Offer Unlimited Credits Ultimate KPI
- Unlimited Credits Ultimate KPI