Power BI Ultimate Waterfall Custom Visual (Release!) – Power BI Visualisierungen
- Waterfall charts have other names as well, walk charts, bridge charts, flying brick charts, and Mario chart (as in Nintendo).
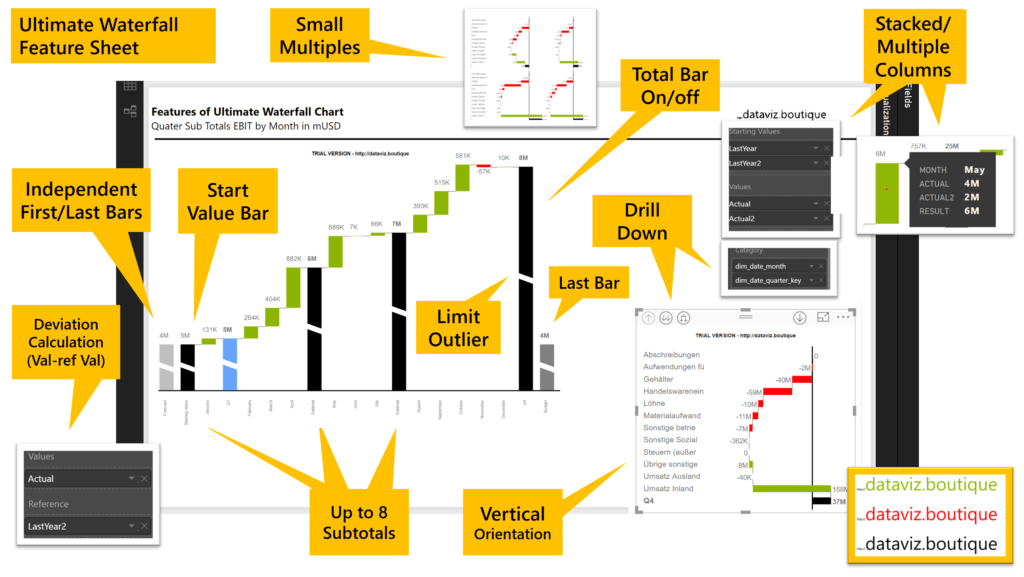
- Calculation waterfalls (vertical axis) – The status bars represent base and result measures (e.g. sales and EBIT) whereas the contribution bars in between represent the increase or decrease of the measures.
- Chart Orientation – choose for Time Series the horizontal and for categories the vertical orientation
- IBCS (R) Color Theme as default Colors
- Small Multiples – in both Orientations, change the amount of column or rows
- Scaling within Small Multiples
- Define up to 8 Subtotals
- Support for Variance Waterfalls
- Define Start Value
- Define or calculate Deviation as increase/decrease
- Total Value = Start Value +/- increase/decrease
- Limit Outliers
- Stacked Value Fields
- Independent First Bar & Last Bar
- Drill Down and Up
- Hatched Bar Background
Views: 1028


