50 Credits
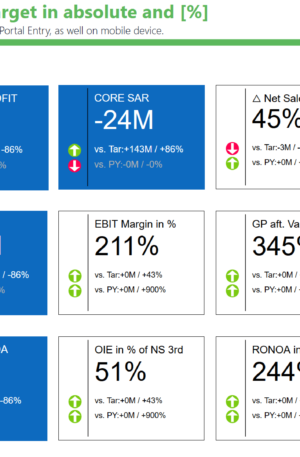
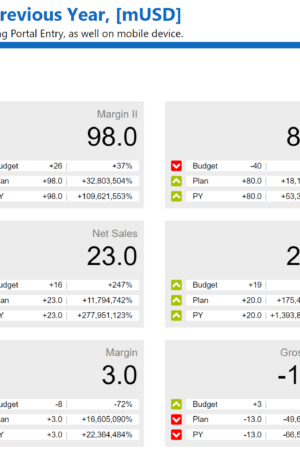
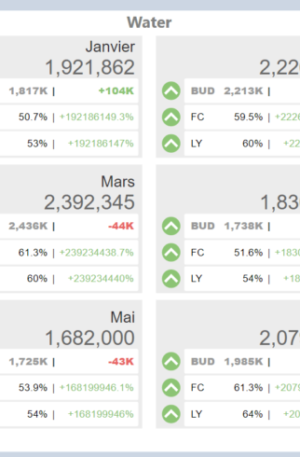
… The Power BI Ultimate KPI Chart Custom Visual. The visual shows a value, its variance to a reference value and its variance to second reference value. in absulte ad in [%] with Arrow and Color Indicator.
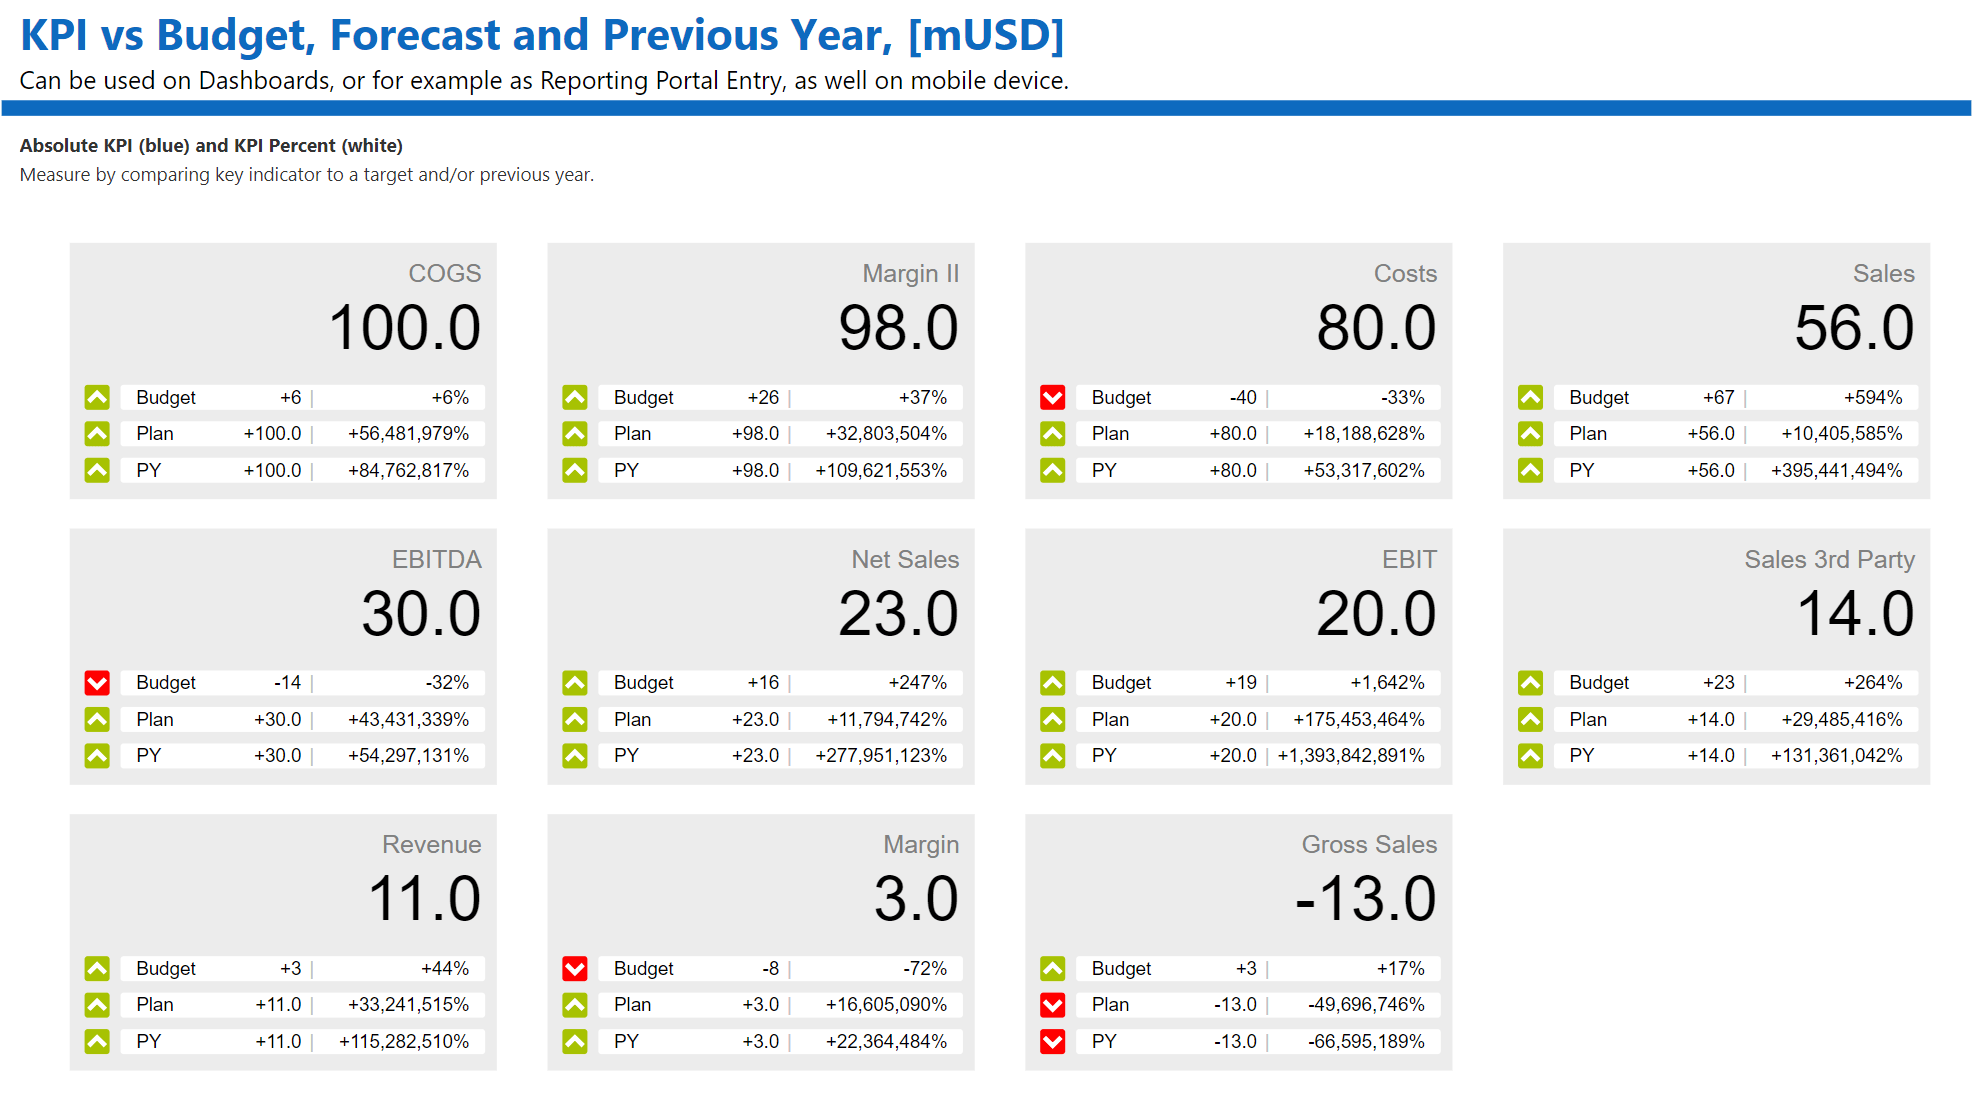
… The Power BI Ultimate KPI Chart Custom Visual. The visual shows a value, its variance to a reference value and its variance to second reference value. in absulte ad in [%] with Arrow and Color Indicator.
| Brand | dataviz.boutique |
|---|