Showing 1–12 of 45 resultsSorted by price: low to high
Power BI Ultimate Charts Custom Visuals
Ultimate Charts is the broad Dataviz product category for Power BI custom visuals used in financial reporting, management dashboards, controlling, and analytical reporting. The category brings together several visual families, including Ultimate Waterfall, Ultimate Variance, Ultimate KPI, Ultimate Decomposition Tree, Ultimate Stacked, Ultimate Venn Diagram, Ultimate UpSet Plot, and Ultimate Sankey for Finance.
This landing page is the best starting point when the reporting requirement is not one single visual, but a complete Power BI visual toolkit. Finance teams often need waterfall bridges, variance views, KPI cards, decomposition trees, stacked composition charts, set-overlap analysis, and financial Sankey flows in the same reporting environment. Ultimate Charts groups these options so teams can choose the right visual for each reporting question.
What the Ultimate Charts family covers
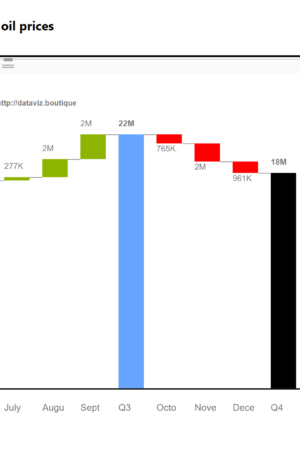
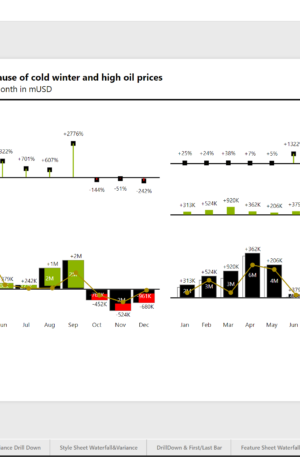
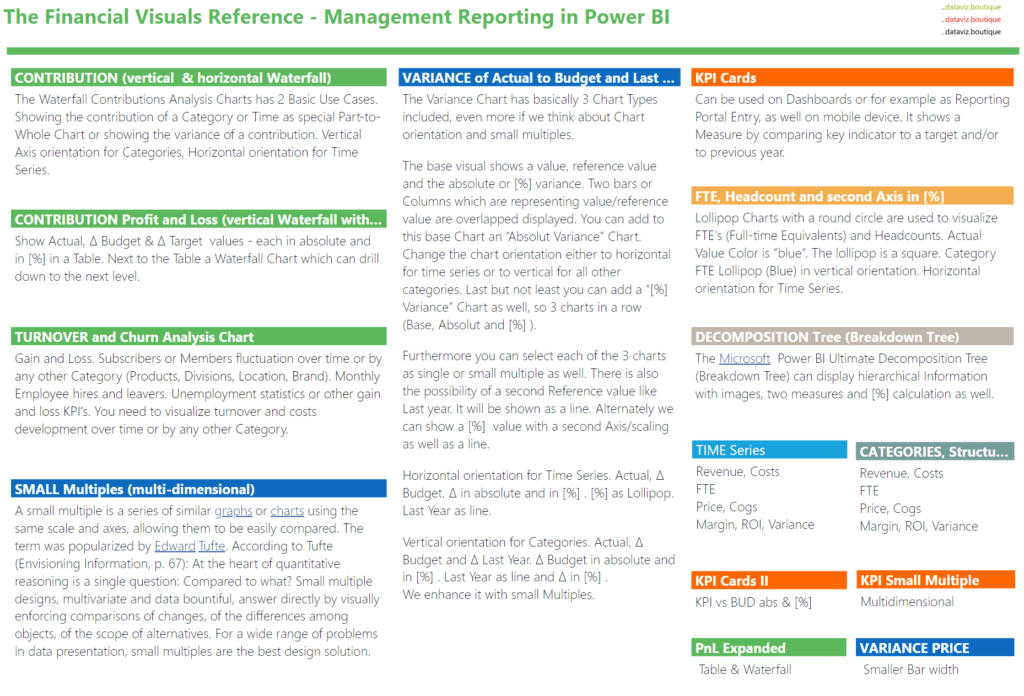
- Waterfall charts for bridges, subtotals, and financial movement explanations.
- Variance visuals for actual, budget, forecast, target, and previous-year comparisons.
- KPI cards for compact executive status reporting with reference values and arrows.
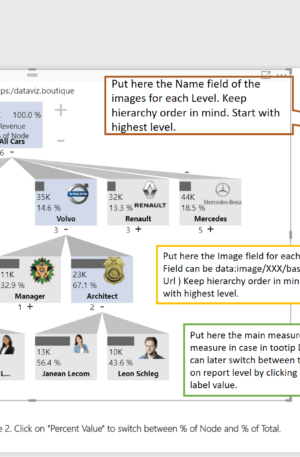
- Decomposition trees for interactive breakdown and root-cause analysis.
- Stacked visuals for category mix, composition, and 100% comparisons.
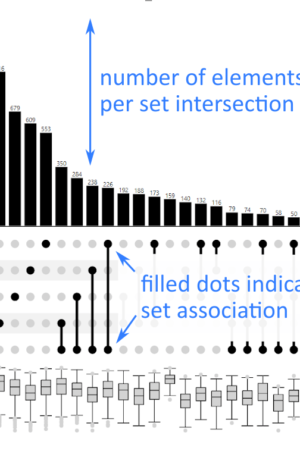
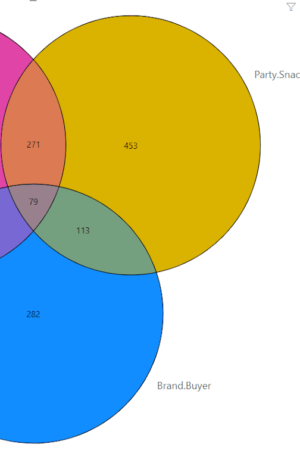
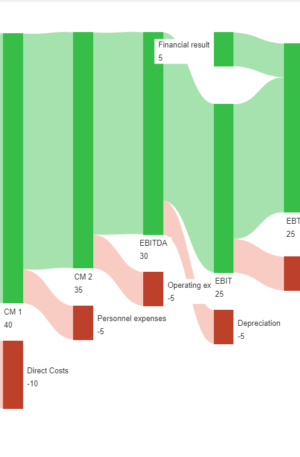
- Venn, UpSet, and Sankey visuals for set analysis and flow-based storytelling.
Who this category is for
Ultimate Charts is most relevant for Power BI report authors, finance analysts, controllers, BI teams, and consultants who build recurring management reports. It is also useful for organizations that want consistent visual language across multiple reports rather than isolated one-off chart solutions.
Licensing and product options
The products below include multiple visual families and license levels. If you already know the exact visual you need, use the specific product category pages for a narrower view. If you are building a broader reporting toolkit, start here.
Available product options
- 10 Credits Ultimate Charts
- 10 Credits Ultimate Decomposition Tree
- 10 Credits Ultimate Variance
- 10 Credits Ultimate Waterfall
- 15 Credits Ultimate Charts
- 15 Credits Ultimate Decomposition Tree
- 15 Credits Ultimate UpSet Plot
- 15 Credits Ultimate Variance
- 15 Credits Ultimate Venn Diagram
- 15 Credits Ultimate Waterfall
- 2 Credits Ultimate Decomposition Tree
- 2 Credits Ultimate Sankey for Finance
- 2 Credits Ultimate UpSet Plot
- 2 Credits Ultimate Variance
- 2 Credits Ultimate Waterfall
- 20 Credits Ultimate Charts
- 20 Credits Ultimate Decomposition Tree
- 20 Credits Ultimate Variance
- 20 Credits Ultimate Waterfall
- 30 Credits Ultimate Decomposition Tree
- 30 Credits Ultimate Variance
- 30 Credits Ultimate Venn Diagram
- 30 Credits Ultimate Waterfall
- 45 Minutes Online Training or Consulting
- 5 Credits Ultimate Decomposition Tree
- 5 Credits Ultimate UpSet Plot
- 5 Credits Ultimate Variance
- 5 Credits Ultimate Venn Diagram
- 5 Credits Ultimate Waterfall
- 50 Credits Ultimate Decomposition Tree
- 50 Credits Ultimate UpSet Plot
- 50 Credits Ultimate Variance
- 50 Credits Ultimate Venn Diagram
- 50 Credits Ultimate Waterfall
- 60 Minutes Senior Advisory
- Generic Product 2 for CC Payment
- Generic Product for CC Payment
- Sales Offer Unlimited Credits Ultimate Decomposition Tree
- Sales Offer Unlimited Credits Ultimate UpSet Plot
- Sales Offer Unlimited Credits Ultimate Variance