Showing all 9 resultsSorted by price: low to high
Power BI Ultimate Decomposition Tree Custom Visual
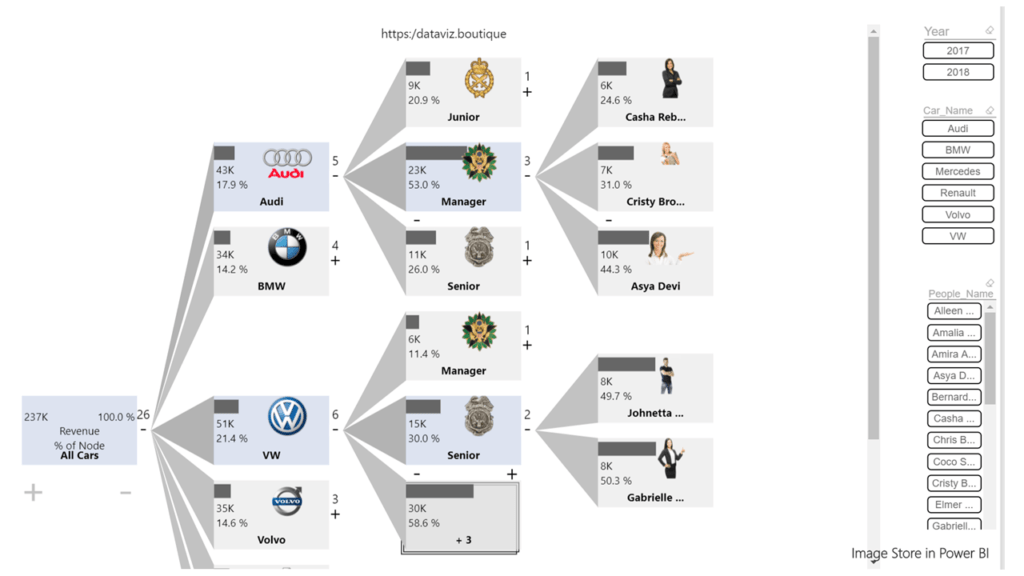
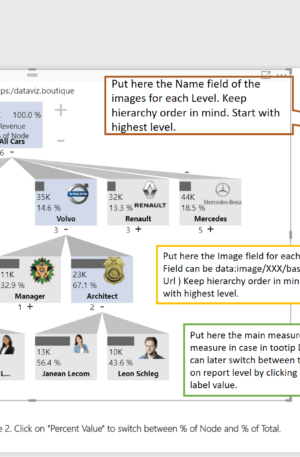
Ultimate Decomposition Tree, also described on the product pages as a Breakdown Tree, is a Power BI custom visual for displaying hierarchical information and drilling into the drivers behind a total. It helps users move from a headline number to the contributing dimensions behind it, such as region, product, customer, cost center, channel, business unit, or account.
This category is useful for teams that need interactive root-cause analysis inside Power BI. Instead of creating many separate drill-through pages or static tables, a decomposition tree lets report users follow the structure of the data and identify the branches that explain the result.
Typical use cases
- Sales breakdowns by region, product, customer, or channel.
- Cost and margin analysis by cost center, account, project, or business unit.
- Operational root-cause analysis where users need to explore multiple dimensions.
- Executive dashboards that need an interactive explanation path behind the headline KPI.
Key features
The visual is built for hierarchical analysis and business-friendly exploration. It helps report readers see which branches contribute most to a result and gives analysts a structured way to guide the investigation without leaving the report page.
Licensing and product options
The products below provide different license levels for Ultimate Decomposition Tree. Choose the option that fits your deployment size and expected usage across report authors and readers.
Available product options
- 10 Credits Ultimate Decomposition Tree
- 15 Credits Ultimate Decomposition Tree
- 2 Credits Ultimate Decomposition Tree
- 20 Credits Ultimate Decomposition Tree
- 30 Credits Ultimate Decomposition Tree
- 5 Credits Ultimate Decomposition Tree
- 50 Credits Ultimate Decomposition Tree
- Sales Offer Unlimited Credits Ultimate Decomposition Tree
- Unlimited Credits Ultimate Decomposition Tree