Showing all 9 resultsSorted by price: low to high
Power BI Ultimate Waterfall Custom Visual
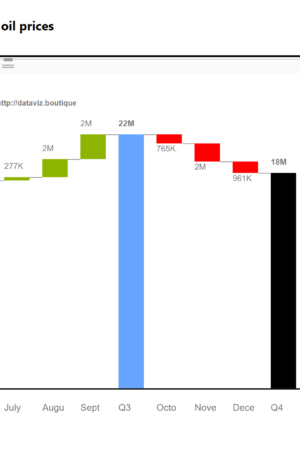
Ultimate Waterfall is a Power BI custom visual for financial reporting, variance analysis, management reporting, and IBCS-style business presentations. It helps finance, controlling, and business intelligence teams explain how a starting value changes into an ending value, step by step, using clean waterfall charts that are easier to read than generic chart workarounds.
The visual is designed for reports where the bridge between two values matters: actual versus budget, current year versus previous year, forecast versus plan, revenue to gross profit, EBITDA bridges, cost development, cash-flow movements, and other management reporting scenarios. The product pages describe waterfall charts as walk charts, bridge charts, flying brick charts, and Mario charts; this category brings those licensing options together for teams that need the same dedicated visual across multiple reports.
What Ultimate Waterfall is useful for
- Variance bridges between actuals, budgets, forecasts, and prior-year values.
- Financial statement explanations such as revenue, margin, cost, EBIT, EBITDA, and cash-flow changes.
- Management dashboards that need subtotals, calculation waterfalls, and clear positive/negative contribution logic.
- Interactive Power BI reports where users need drill-down and category-level explanation.
Key features
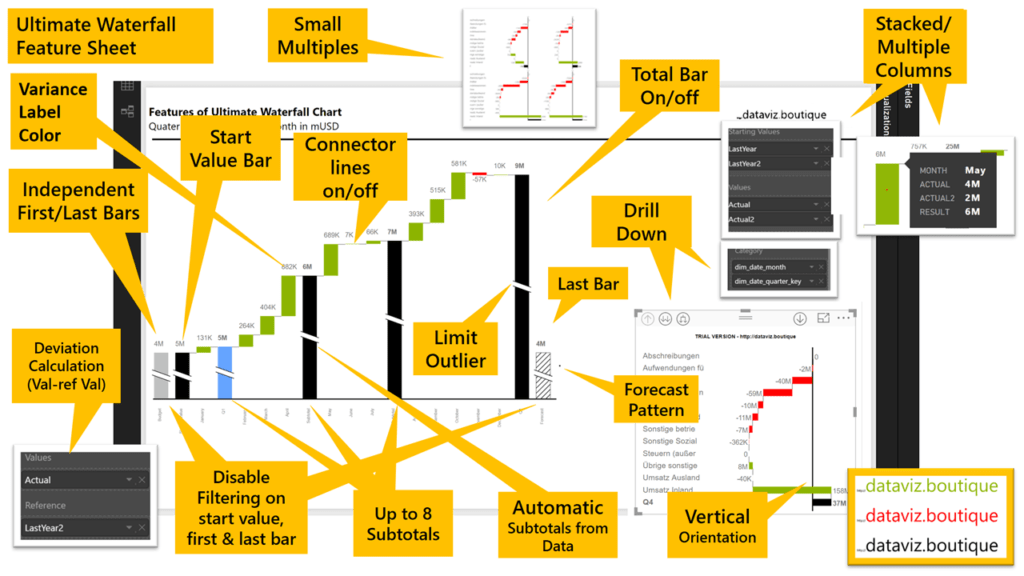
Ultimate Waterfall supports calculation waterfalls, subtotals, positive and negative variance formatting, flexible labels, and report-ready styling. It is especially useful when the report has to communicate the reason behind a change, not only the final number. The visual keeps the structure clear for executives while still giving analysts control over sorting, grouping, labels, and formatting.
Licensing and product options
This category contains the available Ultimate Waterfall licensing options. Choose a smaller license when you need a limited deployment or testing setup, or a larger license when the visual will be used across a wider reporting team.
Available product options
- 10 Credits Ultimate Waterfall
- 15 Credits Ultimate Waterfall
- 2 Credits Ultimate Waterfall
- 20 Credits Ultimate Waterfall
- 30 Credits Ultimate Waterfall
- 5 Credits Ultimate Waterfall
- 50 Credits Ultimate Waterfall
- Sales Offer Unlimited Credits Ultimate Waterfall
- Unlimited Credits Ultimate Waterfall